Chicago Fed NFCI
-0.558
-0.002 vs prior week · index
Observation period:
A browser-based macro terminal: regime models, systematic signals, volatility analytics, company intelligence, and a live news tape — connected in one research workflow instead of twenty tabs.
-0.558
-0.002 vs prior week · index
Observation period:
7.7%
Rank ≤ current · last 260 weekly observations
Observation period:
4.75%
Q3 2026 estimate · annualised growth, SAAR
Observation period:
0.41 pp
0.00 pp vs prior observation
Observation period:
NFCI measures financial conditions, not a regime forecast. GDPNow is the Atlanta Fed estimate, not a Zinscapital model. Observation periods are not publication dates.
Family-office roots
Research informed by family-office practice
Connected workflow
Macro to portfolio risk
Transparent method
No black-box signals
Real product
Live terminal workspaces
Who this is for
Frame allocation decisions across the regime, the securities, and the family's exposures.
Explore the workflowTest a thesis across macro, positioning, and portfolio risk before committing capital.
Explore the workflowTrace the inputs, compare competing explanations, and document the investment case.
Explore the workflowInspect trend signals, volatility structures, and historical tests in one research workflow.
Explore the workflowSo the macro work gets done anyway — across a data provider here, a spreadsheet there, three chart sites, a PDF folder, and a news feed nobody filtered.
The workflow is the bottleneck.
Every question means rebuilding context by hand. Nothing carries from the macro read to the security to the position.
One chain. On every desk, not one.
The regime call, the confirmation, the security work, and the exposure all live in the same workspace — in the browser, on every desk.
How the terminal works
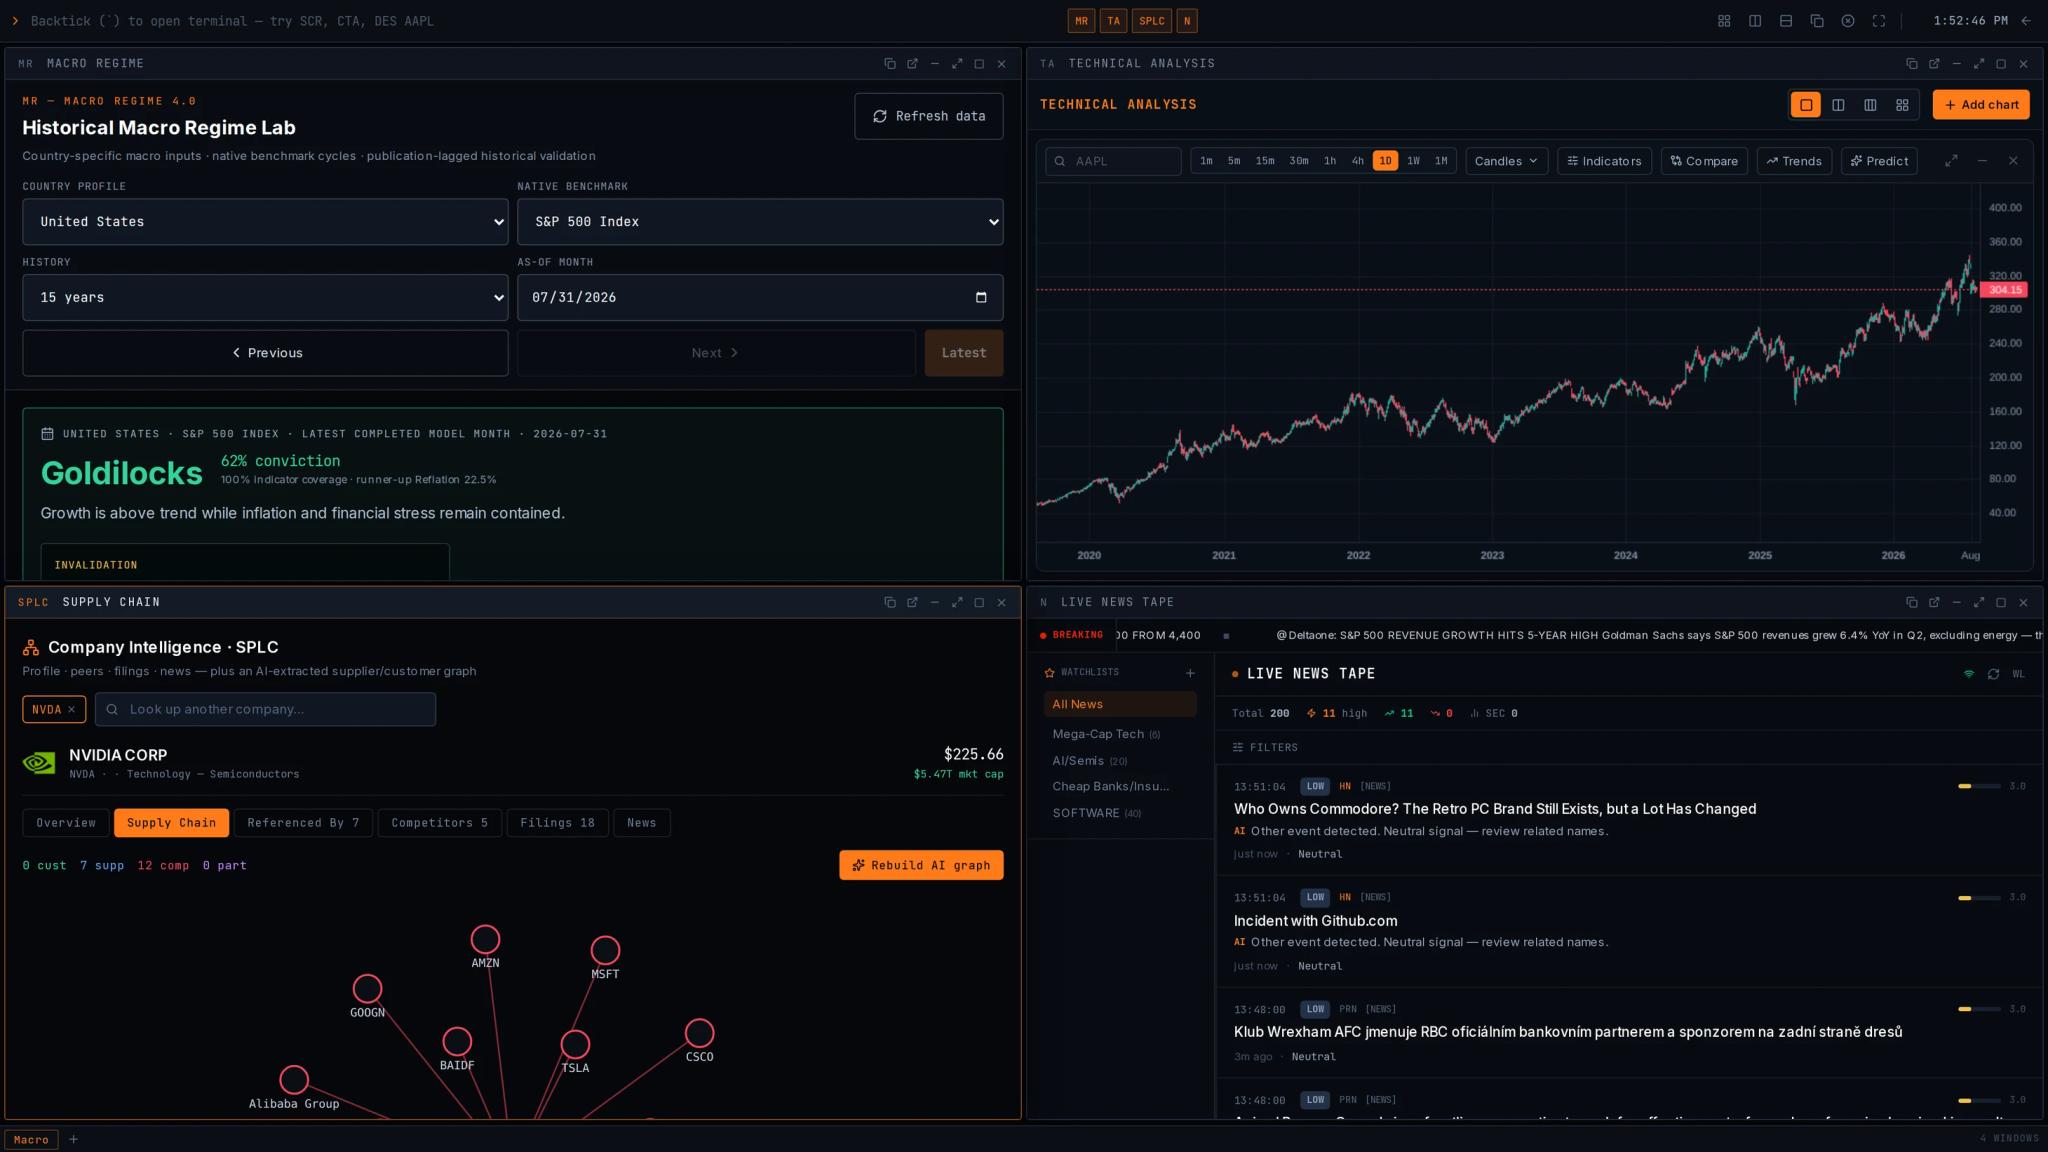
A macro read is never one screen. The workspace lets you put the regime call, the chart, the surface, and the tape next to each other and keep them there — the layout is yours, not ours.
Press ` or ⌘K and type a mnemonic. MR for the macro regime, SPLC NVDA for a company’s chain. Code first or ticker first — both parse.
Not a page you navigate to. Each module is a movable, resizable window on one canvas, so opening the next thing never closes the last one.
Grid, columns, rows, or cascade from the toolbar — or Alt+G to snap everything open into an even grid, sized to the screen.
Name a workspace and switch between them with Alt+1…9. Each one comes back the way you left it, next session included.
The canvas needs tablet-landscape width or wider. Every module also opens as a full responsive page on its own.
Request accessSystematic OS
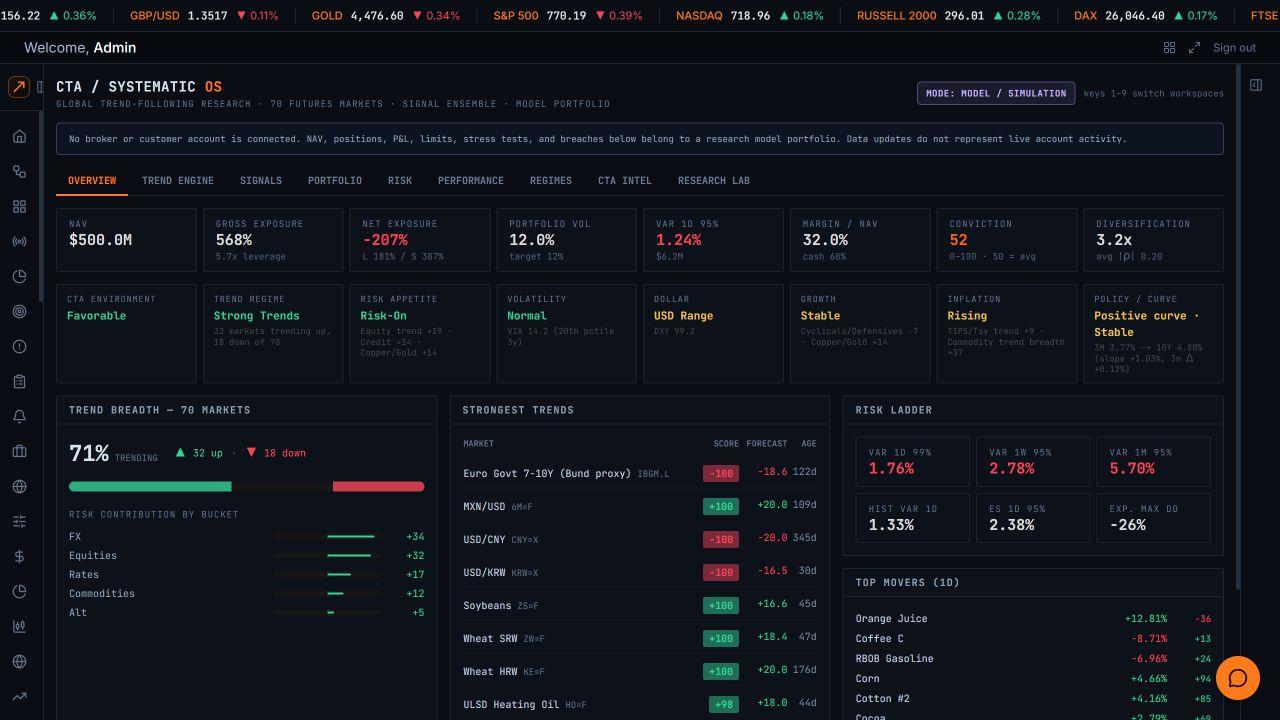
Trend, carry, and crowding across 70 futures markets, assembled into a model portfolio with volatility-targeted sizing, a risk ladder, and replication analytics against the managed-futures industry.
Volatility Lab
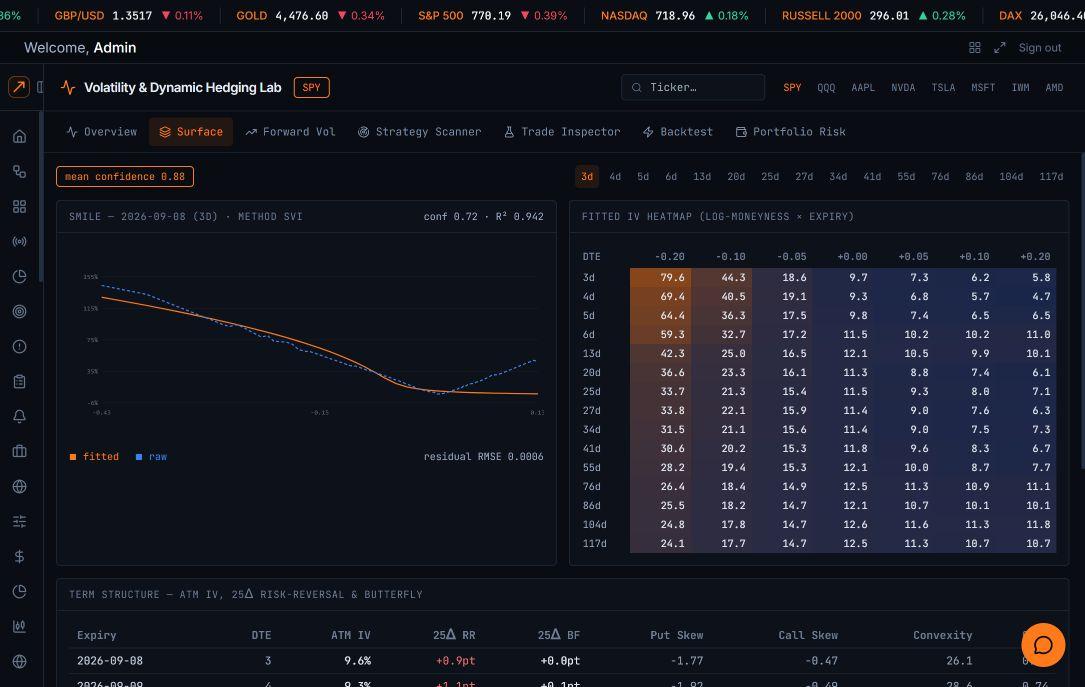
A fitted volatility surface with forward vol, shadow Greeks, strategy scanning, and point-in-time backtesting — the hedging desk's view of an underlying rather than a single option chain.
Company Intelligence
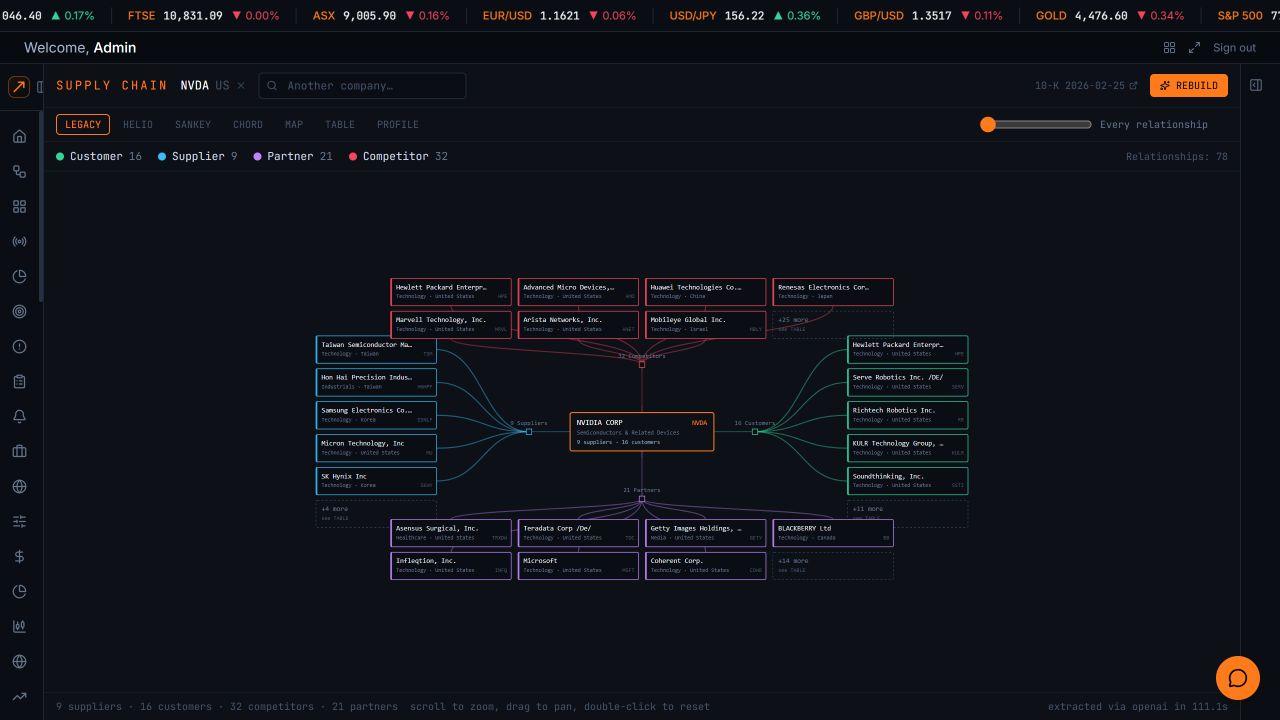
Customers, suppliers, and competitors extracted from filings into one graph, so a print, a tariff, or a guidance cut can be traced to the names that sit downstream of it.
Power & AI-load desk
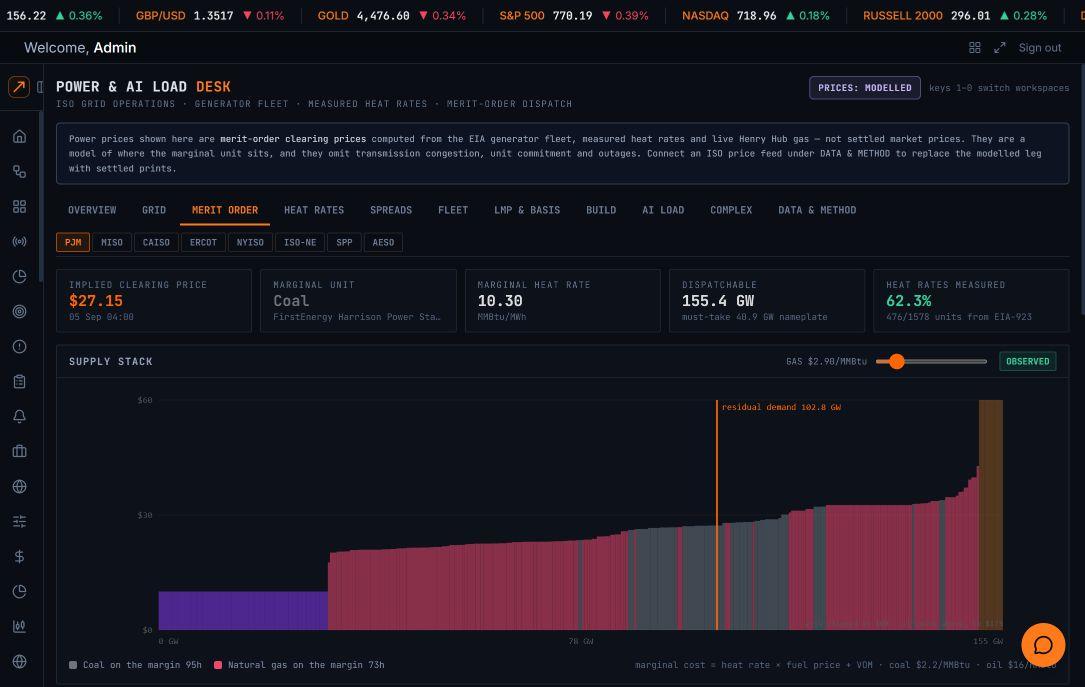
Study electricity markets, generation economics, and data-centre demand together. Keep physical capacity and market pricing in the same research frame.
Function index
The same commands used inside the terminal. Twelve entry points are named here; explore the rest in your workspace. Coverage depends on your subscription.
Model Portfolio
The ZinsCapital model portfolio is traded by Felix Zinsmeyer with the same process the terminal is built around — regime first, then exposure. Exclusively for members: replicate the book position by position, with every holding and weight visible inside the terminal.
Since inception
—
Trailing 12M
—
Sharpe ratio
—
Max drawdown
—
Live performance since inception (April 2025), all series indexed to 100. Past performance is not indicative of future results. The model portfolio is published for informational and educational purposes only and is not investment advice, portfolio management, or a solicitation to trade.
Every signal has a place in the chain. That makes the workflow easier to audit, communicate, and improve.
Define growth, inflation, and policy direction before interpreting asset moves.
Read liquidity, credit impulse, real rates, curves, and funding stress together.
Test the thesis through FX, credit, commodities, breadth, and positioning.
Map the confirmed regime to securities, scenarios, and exposures.
Product proof
Trust should come from what you can inspect: product screens, methodology, source transparency, research output, and an active release trail.
See the source families, update patterns, and methodology notes.
Review the structure and level of detail before you subscribe.
Understand how indicators move through the four-layer process.
Follow the functions, refinements, and product updates shipping now.
Pricing
One public pricing system across the website and product.
Three levels of coverage. One research workflow.
Published subscription pricing. Access is subject to onboarding availability.
Core macro & market context to start with.
Billed monthly
Request MacroThe complete research workflow.
Billed monthly
Request ProfessionalResearch through to positions and portfolio risk.
Billed monthly
Request PortfolioInstitutional
Seats, research coverage, and integration requirements scoped together. Written pricing follows a walkthrough; no standard institutional minimum has been published.
Arrange a walkthroughSample research
Request the sample macro report and occasional product research updates. No daily marketing blast.
Macro Regime Brief
Clear product state, clear plans, and no execution or advisory ambiguity.
Single-family offices, emerging managers, independent research desks, and systematic or quant traders who need a repeatable macro research process without a traditional terminal installation.
Submit an access request or arrange a walkthrough. We will contact you about availability and the appropriate coverage for your desk. Submitting a request does not create an active terminal account or start a paid subscription.
No. ZinsCapital is a research and analytics platform. It does not execute trades, hold client assets, manage portfolios, or provide personalised investment advice.
The research functions follow one sequence: classify the global regime, assess monetary and credit conditions, seek cross-asset confirmation, then map the result to securities and portfolio exposures.
No. The terminal runs in the browser on any machine, with no desktop client, no dedicated hardware, and no per-seat licence negotiation.
Arrange a walkthrough to discuss your team's seats, data-delivery requirements, configured workflows, and onboarding. Institutional scope and pricing are agreed individually; integrations are not implied to be available for every series.
Your macro process, connected
Request access to the terminal, or speak with us about an institutional workflow.